
Having a set of interpretations about the results of research is a great tool provided by statistical analysis.
This type of analysis also allows us to develop statistical models, design surveys, and research studies, especially when dealing with large volumes of data.
We know that data analysis involves a thorough review of each part of a set to understand its structure and interpret its functioning. Statistics, on the other hand, is the science that uses probabilities as a basis to influence the possible results of situations determined by numerical data when collecting, interpreting, and determining their validity.
Let’s learn more about this type of analysis and how you can implement it.
What is statistical analysis?
Statistical analysis is a tool used to examine and understand data. It involves a set of techniques and methods that allow for the organization, description, analysis, and interpretation of data to obtain meaningful and useful information.
Statistical analysis occurs when we collect and interpret data with the intention of identifying patterns and trends. While it is a type of data analysis in itself, it is approached with an interpretive angle that is useful for making specific decisions and understanding potential customers of a company, their behavior, and experiences.
Today, statistics is an essential tool for analyzing research data because from the conception of the idea to be investigated, through the definition of objectives, hypotheses, variables, data collection, organization, review, classification, tabulation, and production of results for analysis, it is important to know how to use different statistical measures and models appropriately.
When achieved, the results obtained represent a true contribution to solving the problems inherent in the field where the activities of various research are carried out.
Advantages of conducting statistical analysis
Conducting statistical analysis can have several advantages, including:
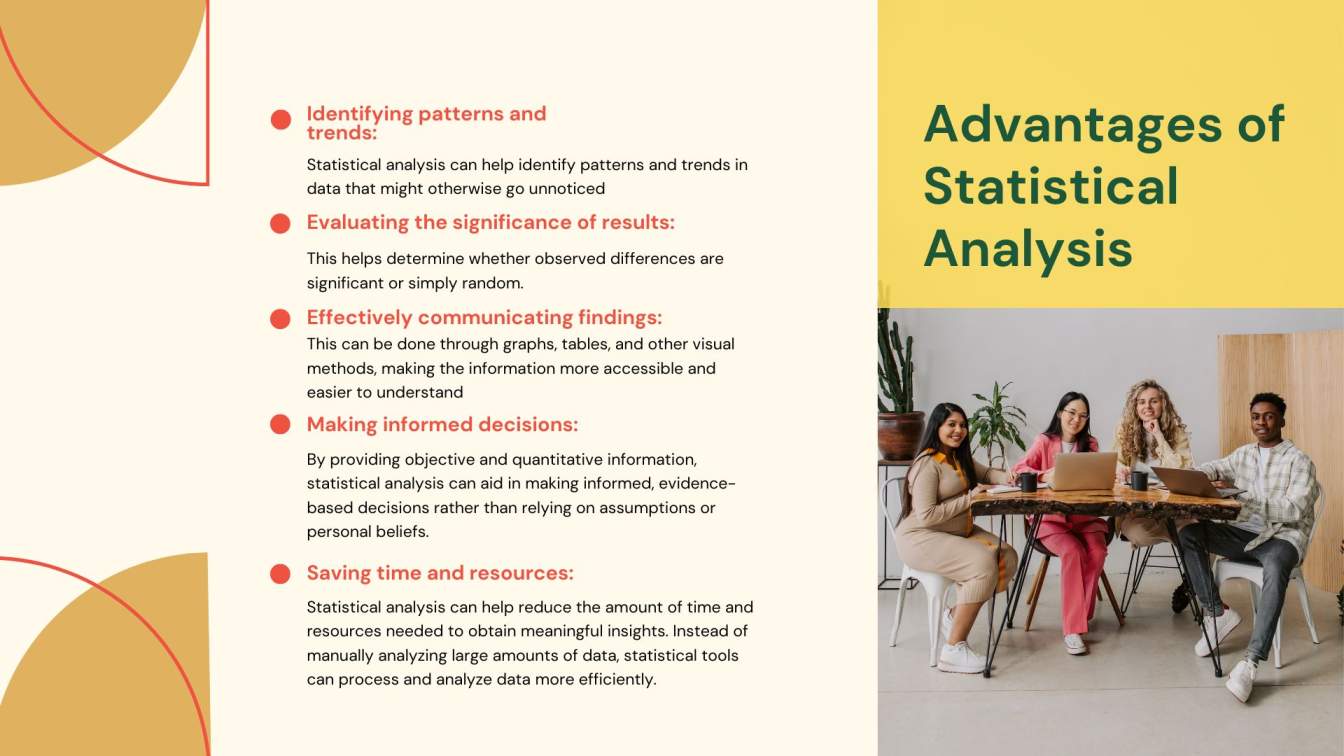
Identifying patterns and trends: Statistical analysis can help identify patterns and trends in data that might otherwise go unnoticed.
Evaluating the significance of results: This helps determine whether observed differences are significant or simply random.
Making informed decisions: By providing objective and quantitative information, statistical analysis can aid in making informed, evidence-based decisions rather than relying on assumptions or personal beliefs.
Saving time and resources: Statistical analysis can help reduce the amount of time and resources needed to obtain meaningful insights. Instead of manually analyzing large amounts of data, statistical tools can process and analyze data more efficiently.
Effectively communicating findings: This can be done through graphs, tables, and other visual methods, making the information more accessible and easier to understand.
Uses of statistics in data analysis
By providing a clearer interpretation of a dataset, from qualitative to quantitative data, through analysis and categorization, we can manipulate and adjust situations in specific contexts with appropriate decision-making.
When we have a broader understanding of the trends surrounding our market, we stay ahead, as we can use statistical analysis to predict future behaviors as a result of implementing appropriate risk management strategies.
Additionally, we will have specific data on consumer behavior to identify their preferences, the products or services that are most and least attractive to them, and how to approach them to make a purchase.
What can we do with statistical analysis?
With statistical analysis, we can answer questions such as:
- Who are our customers?
- How much does a customer spend per visit?
- What is the age of our customers?
- How can we classify our types of customers?
- What kind of experience do our customers enjoy?
Identifying patterns of behavior or different trends in a dataset helps companies observe and record customer purchasing behavior, both to improve products or services and to facilitate an updated and enhanced shopping experience, resulting in satisfied customers and a strong brand reputation.
Read also: Best 3d modeling software for 3d printing
How to perform statistical analysis?
Here are some steps to perform statistical analysis:
Define the problem: It is important to have a clear understanding of the problem or question you want to answer with statistical analysis. For example, what is the relationship between age and income in a specific population?
Collect the data: Once the problem has been defined, it is necessary to collect the data needed to answer the question. This may include surveys, experiments, records, or other sources of information.
Organize the data: Once the data has been collected, it is important to organize it in a way that allows for further analysis. This may include creating tables, graphs, diagrams, or any other tools that facilitate understanding of the data.
Analyze the data: In this step, statistical techniques are applied to obtain meaningful and useful information from the data. This may include identifying trends, patterns, relationships, correlations, and any other relevant information that allows you to answer the question posed.
Interpret the results: Once the data has been analyzed, it is necessary to interpret the results and draw conclusions. It is important to consider the limitations of the data and techniques used, and to consider any other relevant information that may influence the conclusions.
Present the results: Finally, it is important to present the results in a clear and concise manner that allows others to understand the conclusions and decisions based on the statistical analysis.
Tips for performing a functional statistical analysis
To perform a statistical analysis, we need to collect and review the data samples available in the results of the study to be analyzed.
Although there is no single way to carry out an interpretive analysis, there are practices that can be replicated in any study if they are carried out appropriately to the information provided. These tips will allow us to carry out a useful statistical analysis.
- Give a clear and realistic description of the data we have.
- Analyze how the data relates to the study subjects.
- Design a model that considers and describes the relationship between the data and the study subjects.
- Evaluate the model to determine its validity.
- Consider scenarios and tests using predictive analytics .
Conclusion
Statistical analysis is an important tool for obtaining meaningful information and making informed decisions in a variety of fields and situations. However, in order to perform effective statistical analysis, it is essential to have accurate and reliable data. Careful collection and organization of data is crucial to ensuring that the results of statistical analysis are accurate and relevant.